 Cyril Gagnaire
Why You Should Build Your House with Databricks
There are a lot of platforms both new and old available for managing data at an enterprise scale. When it comes to refreshing the foundation of a...

Microsoft wants to recreate the undeniable success of Power BI but with a wider data remit by including Data Engineering, Data Warehousing and Data Science audience in the mix, amongst a few other additions.
Introducing Fabric!
Fabric is Microsoft’s first SaaS offering in its data service portfolio. Until now, only PaaS were available (Data Factory, Synapse, …)
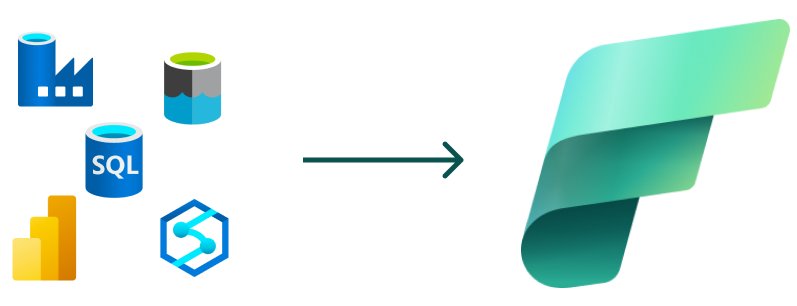
This article is not focusing on talking about Fabric and its components but more about how to structure the data that will flow through Fabric. The underlying data layer in Fabric is powered by One Lake. Think about One Lake as a single data repository where all the data will reside. In practice, it’s a single dedicated Azure Data Lake Gen 2 Storage Account (ADLS2).
For more in depth information about Fabric and its components, the official Microsoft documentation should be your first point of call, but if you are like me, my LinkedIn feed is flooded with blog posts and updates on Fabric. So finding more information about it shouldn’t be an issue.
As any data professional would tell you, dumping a bunch of data in a single location is a recipe for disaster. Even though all the data is going to reside into that single One Lake location, it is imperative to bring structure and organisation to it.
Enter the Medallion Architecture!
Asking a data engineer what is their favourite Medallion Architecture is the best way to create heated and opinionated debate. It’s like asking someone what their favourite brand of car is or asking a Western Australian if they prefer the Fremantle Dockers or the West Coast Eagles!
So what is a Medallion Architecture?
A medallion architecture is a data design pattern used to logically organise data in a Lakehouse (One Lake in the case of Fabric), with the goal of incrementally and progressively improving the structure and quality of data as it flows through each layer of the architecture.
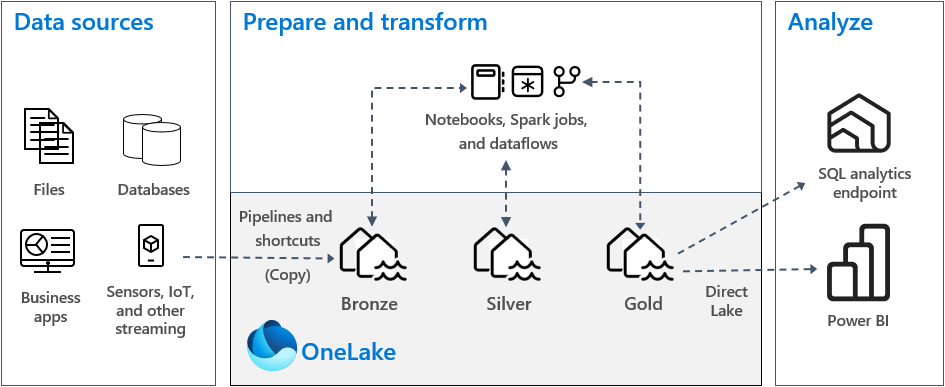
Image courtesy of Microsoft Learn
Each layer of the architecture holds a different tier of your data. As data comes in, it will be promoted through the Medallion Architecture as it is being cleaned up, transformed and refined.
At a minimum, a Medallion architecture would have the following layers (more on that later):
The bronze layer contains unvalidated data. The key to this stage is to ingest the data in its raw state and store it before it is being picked up by the following layers. Data ingested in the bronze layer typically:
Maintains the raw state of the data source.
Is appended incrementally and grows over time.
Can be any combination of streaming and batch transactions.
At this stage, in Fabric, you would typically be using the following artefacts in either the Data Factory or the Data Engineering experience:
Pipelines: Used to orchestrate data movement
Lakehouses: Used to store and organise data
Note: As the data is being ingested, it would make sense to leverage the delta format in One Lake as early as possible. This is where nuances of the Medallion Architecture are starting to creep in. Bear with me and we will discuss this a bit further down.
The silver layer stores data sourced from the bronze layer. The raw data has been cleansed and standardized, and it's now structured as tables (rows and columns). It might also be integrated with other data to provide an enterprise view of all business entities, like customer, product, and others.
This stage is mainly about cleaning and combining data files into delta tables in lakehouses. The data is of good quality and has been verified, but not yet modelled or aggregated.
At this stage, you would typically be using the Data Engineering Experience and would be mainly leveraging:
Lakehouses: Used to store and organise data
Notebooks: Using Spark or SQL to manipulate, clean and transform your data
The gold layer is the final layer. It stores data sourced from the silver layer. The data is refined to meet specific downstream business and analytics requirements. Tables typically conform to star schema design, which supports the development of data models that are optimized for performance and usability.
This is the final layer of the Medallion Architecture, and is typically the interface with data consumers such as Data Analysts, Data Scientists and other data processes.
Depending on the level of complexity of your modelling, you might be using the Data Warehouse, Data Engineering or Power BI experience in Fabric. You would be using:
Lakehouse
Data Warehouse
Data Models
Datasets
In this article, we went through the 3 layers of the typical Medallion Architecture. You might have seen other implementations.
Those should be the layers you should have at a minimum. You might call them differently, but the roles should be similar.
Depending on how complex your use case is, you might even create sub layers, add layers before and after.
Here is an example adapted from this great video from Advancing Analytics’s YouTube video on the Medallion Architecture. I strongly recommend you give it a watch.
In this example, each layers has been expanded to better represent the flow of the data from where it is landed, all the way to the semantic layer:
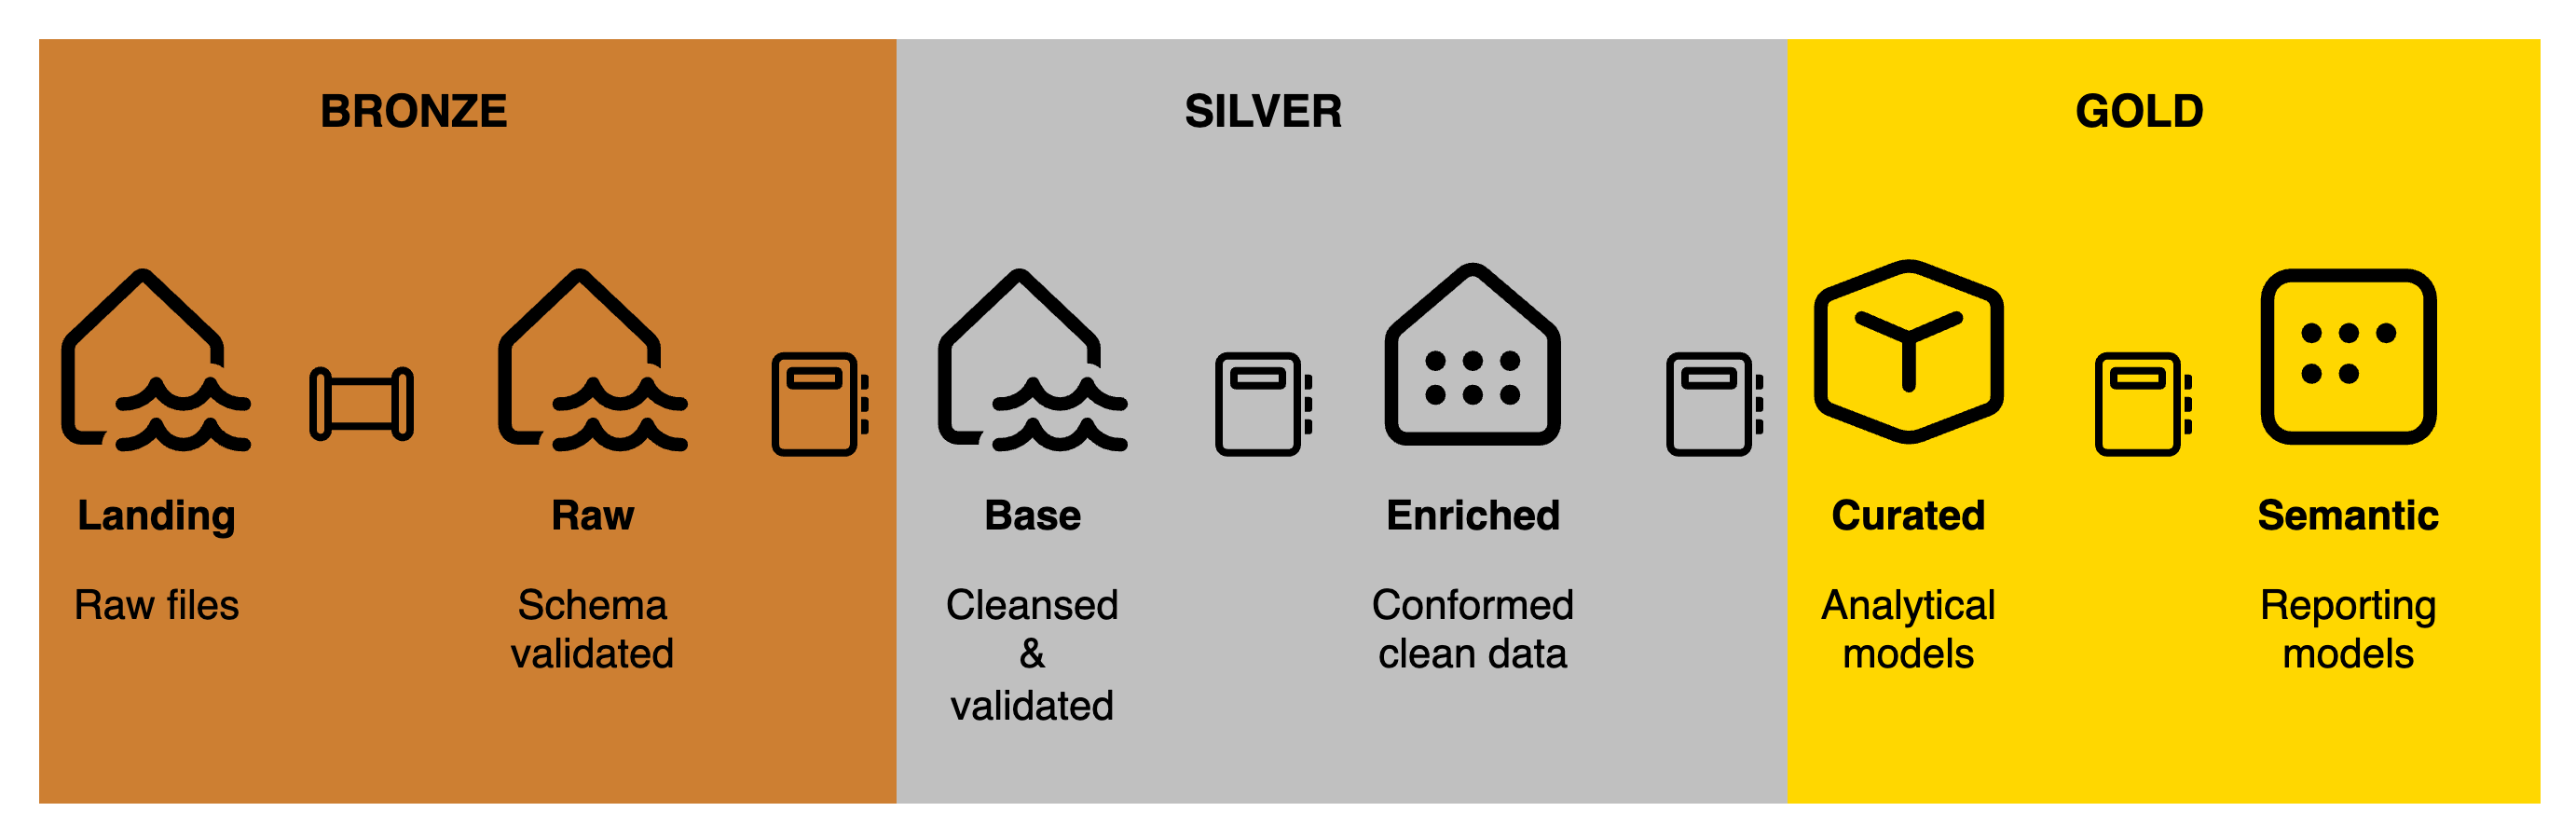
In reality, it doesn’t really matter how many layers you have and what you call them, as long as you and your team are consistent in their use and are on the same page when it comes to the definition of each layer.
Before implementing any significant workflow in Fabric, I would recommend defining the structure of the underlying data. And the Medallion Architecture is a strong candidate for that.
Document the architecture you end up adopting, and most importantly, communicate and educate your developers and main stakeholders on it to ensure everyone is on the same page.
The key success factor for any data architecture is not necessarily which one you end up adopting, but how well it is being understood and adopted by everyone involved.
Just as Microsoft uses "Contoso" as a fictional company in its documentation and tutorials, Arkahna uses its fictitious music streaming service.
Bardic Beatz isn't just another music streaming platform. We're weaving together the ancient allure of bardic tales with modern-day streaming tech. From curated playlists that enchant listeners, to high-res audio that transports you to mystical realms, Bardic Beatz is where music meets magic.
For content creators and music maestros, our platform serves as a stage where their melodies become spells, captivating listeners worldwide.
.png?width=1024&height=1024&name=image-20231102-012055%20(1).png)
In this fictional example, we will be ingesting Bardic Beatz data and see how it gets promoted throughout the Medallion Architecture. In particular, we will be looking at:
User activity logs: Contains raw data on user interactions, like play, pause, skip, and search actions, timestamped and with device information.
Song Catalog: Information about songs available on Bardic Beatz, including song IDs, titles, artists, album names, release dates, and genres.
User Subscriptions: Data on user subscriptions, including user IDs, subscription levels (free, premium), start dates, and renewal information.
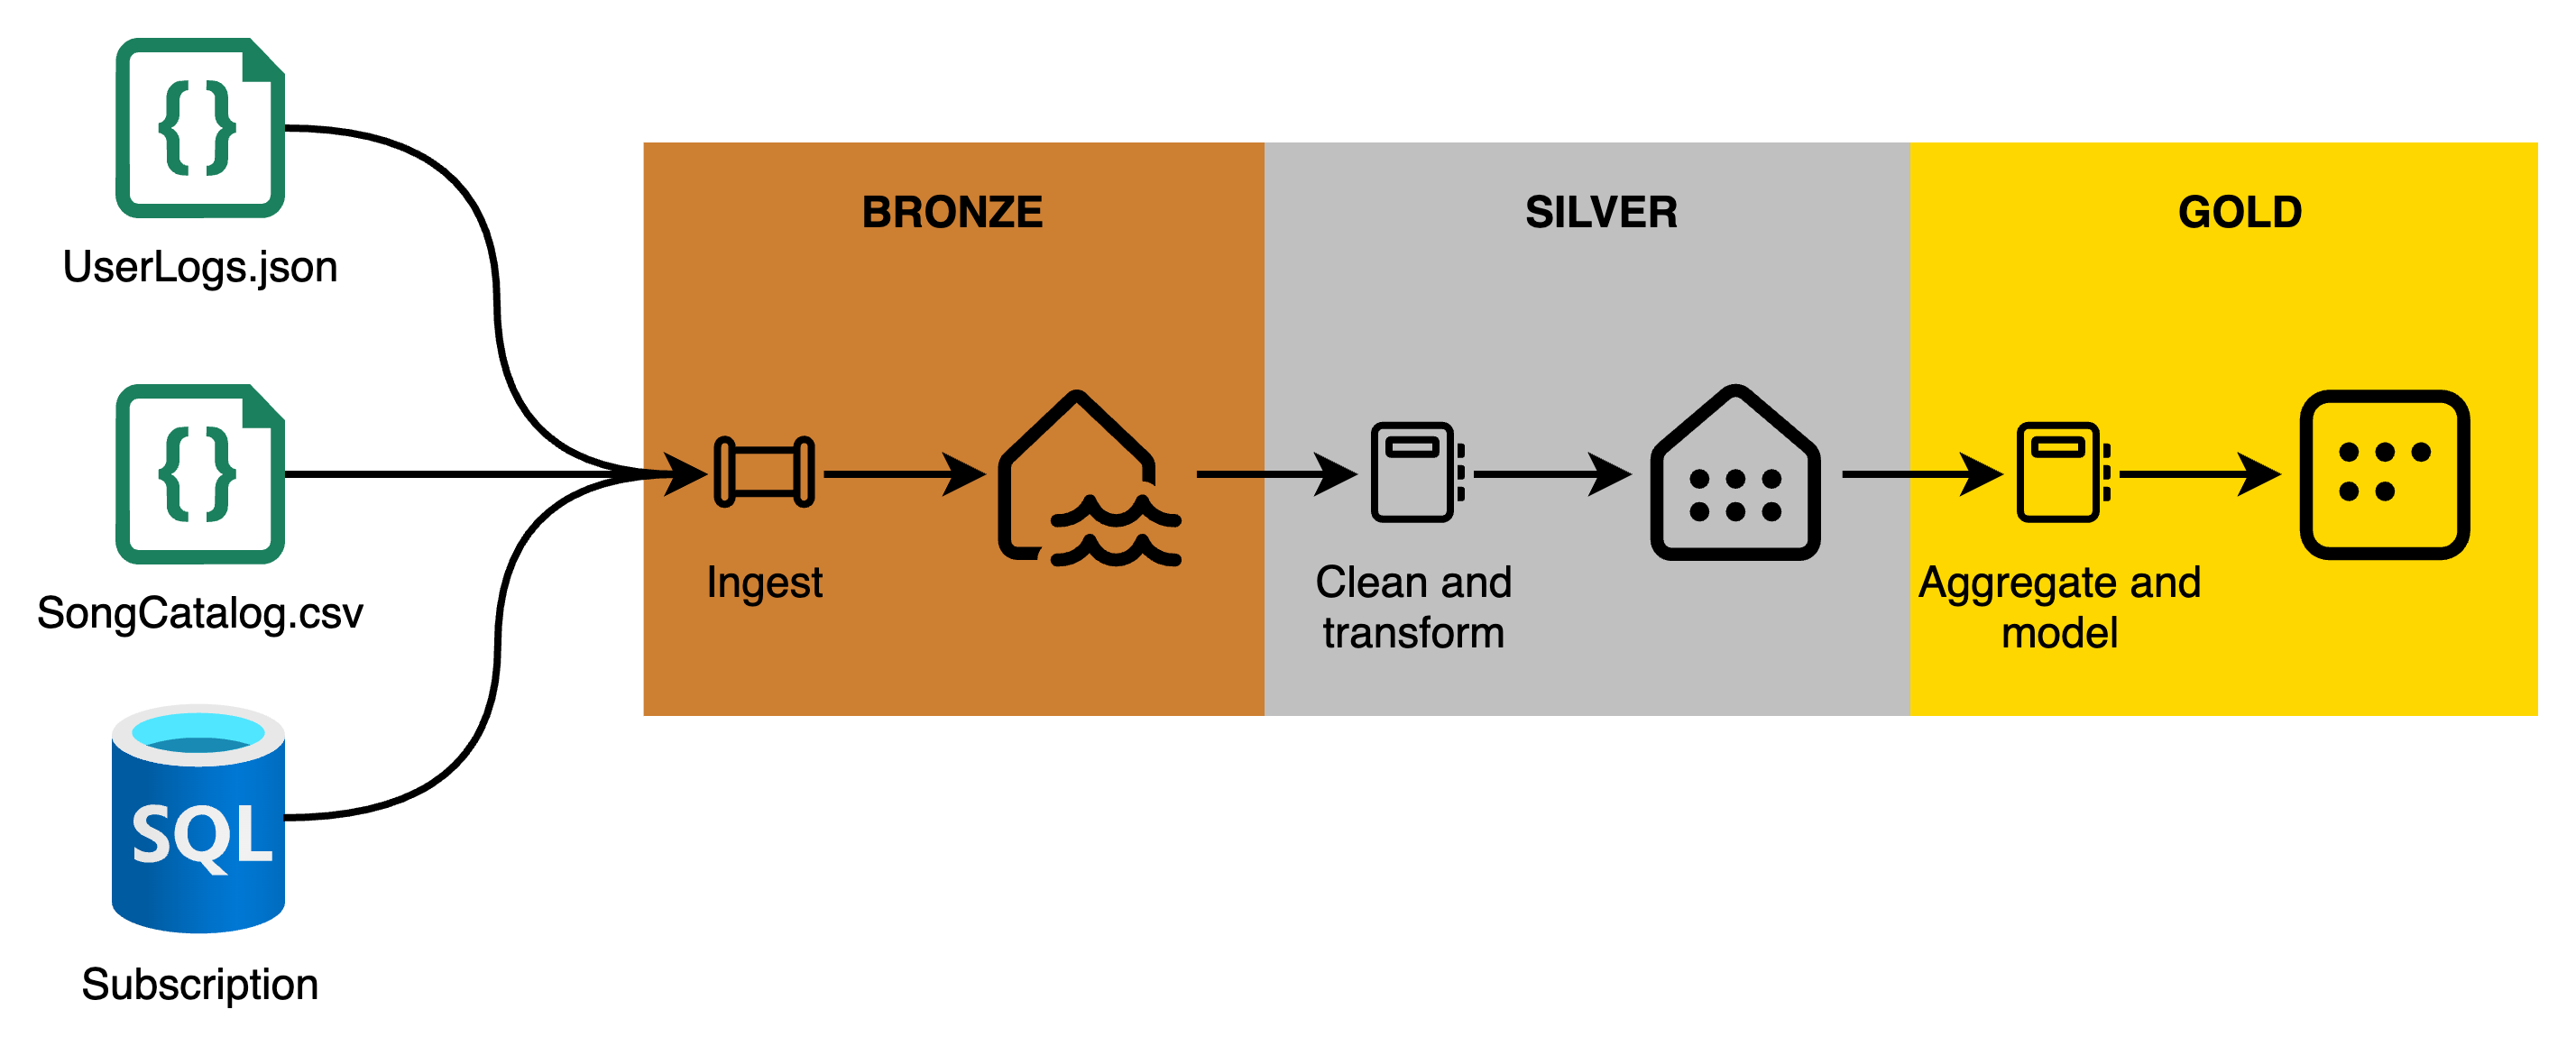
In the bronze layer, we would automate the ingestion of the data from the source systems. Interacting with the different systems, we would either pull the data using pipelines, or the source system would drop data files in a landing zone before it is being processed. The idea is to sigest these datasets into the Bronze layer of the data lakehouse as they are, ensuring all raw details are preserved for future processing and auditing.
In the silver layer, data cleansing is being performed. For example, the activities could take place:
User Activity Logs: Clean data by removing corrupt records, standardizing timestamps to a unified format, and enriching with user subscription details to easily filter by subscription type.
Song Catalog: Deduplicate records, standardize genre classifications, and link songs to artist IDs for easier aggregation.
User Subscriptions: Verify the integrity of subscription periods and flag any discrepancies in renewal or payment statuses.
Stored in a Delta format, we now have the following tables in a Lakehouse in the Silver layer:
A cleaned and enriched User Activity Log that provides a clear view of how different user segments engage with the service.
A refined Song Catalog with standardized metadata that supports accurate recommendation and trending analysis.
A consistent User Subscription dataset that accurately reflects the current subscription status of users.
In the gold layer, our goals is to provide aggregated and analytical data to our internal or external data consumers:
User Engagement Metrics: Aggregate user activity by subscription type, device, time of day, and day of the week to understand peak usage times and preferred devices.
Top Performing Genres and Artists: Summarize play counts and skips by genre and artist to identify trends and preferences across different user segments.
Subscription Insights: Analyze subscription data to identify churn rates, average lifetime value (LTV) of users, and effective subscription models.
From this point, here are some potential application for the data found in the gold layer:
Bardic Beatz Marketing Campaign: Using insights from the Gold layer, the marketing team launches a targeted campaign promoting the most popular genres and artists among premium subscribers. They also introduce a loyalty program aimed at increasing the LTV of long-term subscribers, informed by the Subscription Performance Dashboard.
Product Development: The product team uses device usage patterns identified in the Daily Active User Summary to optimize the app's performance on the most used devices, enhancing user experience.
This example outlines how Bardic Beatz can leverage the Medallion Architecture to systematically process and analyze streaming data to drive strategic decisions and improve service offerings.
How to organise the data layer in Fabric is only one aspect. There is a lot more to consider. Stay tuned for the next instalment in this series as we will deep dive into each of those layers and most importantly look at how to govern Fabric and all its components.
How about you? How many layers do you use? What do you call them? What are their purpose? Let me know in the comments below. I’m genuinely curious.
There are a lot of platforms both new and old available for managing data at an enterprise scale. When it comes to refreshing the foundation of a...
.png)
Part 1: install, extensions, virtual env. Part 2: Initial Libraries and Data Import Whew! Data is in, virtual environment is up, and we have executed...

As the June 30, 2024 deadline approaches, it's crucial for ISVs to seize the opportunity presented by Microsoft's "Transact & Grow" incentive program...