Simplifying Feature Management at DDD Adelaide
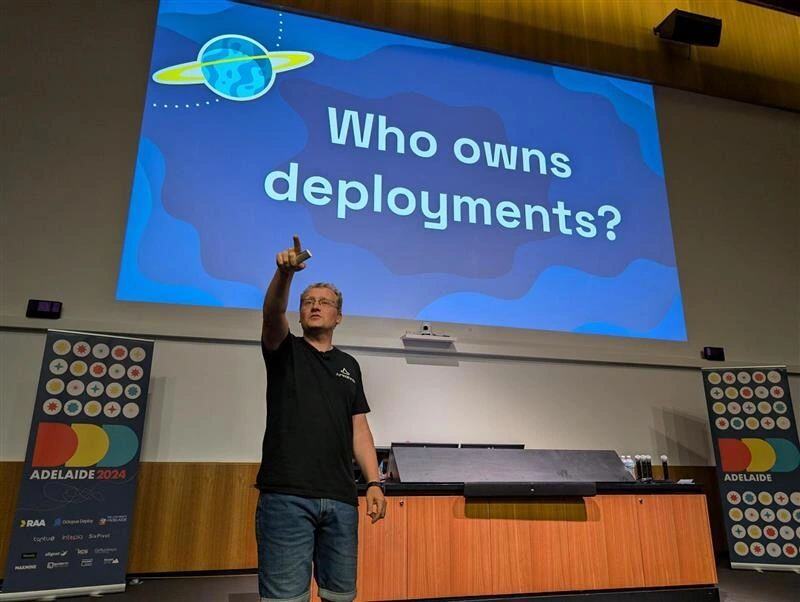
I had an absolute blast attending DDD Adelaide recently! It's always great to be part of a community where developers come together to share ideas,...
10 min read
Microsoft has been steadily investing in OpenTelemetry (OTEL), and the latest Azure Monitor and Application Insights SDKs are now built on this framework. While Application Insights has been around for some time, not all OpenTelemetry concepts align seamlessly with it, and vice versa. This post is designed to help you bridge the gap between these two worlds, offering insights into how things work under the hood and sharing some useful tips to save you time.
As both the OpenTelemetry SDKs and Azure-specific plugins continue to evolve, many of the workarounds discussed here may become unnecessary as Microsoft's OpenTelemetry integrations mature, or as the OTEL SDKs gain the ability to handle currently unsupported features.
It is worth having a read of What is OpenTelemetry? which gives a really nice summary of what open telemetry is first. The TL;DR is, OTEL is a vendor agnostic framework for generation, collection, management, and export of telemetry data to compatible backends (like Application Insights).
Many companies, including Microsoft, Sentry, DataDog and many others are investing in Open Telemetry is that building a comprehensive SDK is a huge amount of investment and individual companies can’t instrument every package in the ecosystem. Open Telemetry allows open source packages to provide vendor agnostic tracing out of the box.
When using .NET, Microsoft have long standardised baking in tracing into the framework and all Microsoft packages. This is why when you turn on Application Insights in a .NET application, you get a pretty good out of the box experience.
Open Telemetry opens the door for other ecosystems, which are not controlled by a single vendor to enable great out of the box experiences by having the entire ecosystem be instrumented with Open Telemetry. You can see the results in the Open Telemetry Registry where there over 800 packages which have been instrumented by the community, and this number doesn’t include libraries which ship with native integration.
It also means that Microsoft can instrument their SDKs using Open Telemetry, so customers using the Azure SDK without Application Insights can still get great telemetry on their usage of Azure products. An example of this is the
@azure/opentelemetry-instrumentation-azure-sdk
package, which allows you to simply add
instrumentations: [createAzureSdkInstrumentation()],
to your OTEL configuration and you will get Azure SDK instrumentation, no matter which Observability backend you are using.
From a software design point of view, we have long known that composition should generally be favoured over abstraction, and enables us to expand over time.
It also means that for local development you can use tools like Jaeger: open source, distributed tracing platform or Standalone .NET Aspire dashboard - .NET Aspire which gives you real time visibility of your local telemetry data rather than sending to a cloud service like Application Insights which can have a delay of a few minutes to view your telemetry data.
This promise is not quite realised as you will see in the rest of this blog post, at least for application insights. If you do not use their SDK, many features will not work properly. By the end of the post, you will understand why and can make a more informed decision around if you want to just use the Application Insights SDK or a more vendor neutral approach.
This section is a bit of a recap of the What is OpenTelemetry? docs with some specific examples.
There are 3 parts to Open Telemetry:
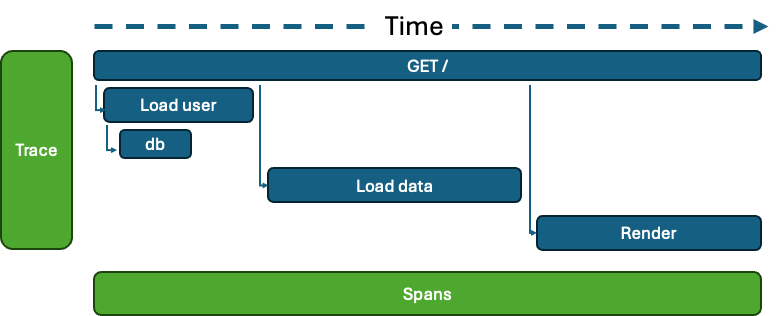
Tracing - the primary type of telemetry, Open Telemetry’s solution to distributed tracing. e.g., a http request. Tracing has 3 main additions to logs, a trace id (the root trace, i.e. the http request), a parent span id (so the parent / child relationship can be modelled far easier than log correlation) and the timing (start/end).
Metrics - simple counters for keeping track of how often something happens, or a number changing over time. e.g., memory usage over time, or how many times users have logged into the system.
Logs - structured logging. e.g. { message: "Service Started", attributes: { port: 3000 } }
Tracing is like logging, with a few extra bits. Namely traces have a traceId and a parent which means they can be built into a tree view, and have a start and an end time.
Traces can be linked to other traces (see the Link to) which allows distributed tracing across systems. For example, if one system enqueues a job, then another picks up the job and processes it, you can see the correlation.

These provide a simpler way to quickly grasp what's occurring in your system. Beyond the spans, you can attach events to spans to offer more detailed insights.
These events could be exceptions or information which you would possibly log, like ‘user.signed-in’ and add some attributes to that event (like the user id).
Metrics are simply numbers and are great for counting how often things happen. Traces and logs can be sampled, so it’s often a good idea to also have metrics which count when things happen and are used in aggregate.
Logs have been around for longer, and are mostly replaced by tracing. You would only really use logging for things which are not correlated to an operation in your system. For example, you could log when the service starts successfully, or the service is shutting down.
These can go to the console (great when trailing a services logs and seeing when it’s started in real time etc) and then be ingested into a log analytics platform, but you will find once you have rich tracing, you will not use logs much at all.
The other main difference for logs and traces is the the approach to dealing with volume. With tracing, you sample the entire trace or not. If the trace is sampled, then you get everything. With logs you use severity and cut out lower level (ie debug) level logs.
Tracing sampling can also be improved by using tail sampling which are available in some open telemetry collector proxies, these can do nice things like sample 1% of traces, but always sample traces which contain a span which has an ERROR status. Now any time your system has an error, even if it doesn’t cause a request to fail, that will never be not included in your observability tool.
This enables you to report data on tracing, metrics, or logging. To fully leverage OpenTelemetry, you should instrument your code with the right SDK, incorporating significant spans, events, and metrics to enhance your observability.
There is an SDK for each type of Telemetry.
The Tracing SDK is available at npm: @opentelemetry/sdk-trace-node
| Function | Code |
| Creating a new span | tracer.startActiveSpan('GET /users', { root: true }, async (span) => { tracer.startActiveSpan('Load users', (loadUsersSpan) => { // Load users... loadUsersSpan.end() }) span.end() }) |
| Adding an event | trace.getActiveSpan().addEvent('my event', { attributes: { prop: 'data' } }) |
| Distributed tracing |
One of the most powerful aspects of tracing is being able to cross service boundaries. To do this you can add additional metadata to your spans when starting them. On the producer side you need to mark the span as a producer. tracer.startActiveSpan( The span context contains the trace id and the current span id. Then on the receiving side: const spanContext = {} // Get from job metadata Now these traces will be linked across system boundaries. |
| Span status |
If any operation has an error you can mark a span as having an error. This will highlight the line in an Application Insights as red. span.setStatus({ code: SpanStatusCode.ERROR }) |
Metrics are simple counters generally and can be reported directly using npm: @opentelemetry/sdk-metrics. Some instrumentations provide automatic reporting of metrics for the library too.
const meter = metrics.getMeter('default')
const fooCounter = meter.createCounter('foo');
counter.add(1, { attributeKey: 'attribute-value' });
Attributes are useful because you can use them to count by in reporting later.
NOTE: If you are using Jaeger for local development, it only supports tracing. The aspire standalone dashboard does support both though and that could be a better option if you want to also use the logging APIs
To log, you use the Logging SDK on NPM.
const logger = logs.getLogger('default');
// emit a log record
logger.emit({
severityNumber: logsAPI.SeverityNumber.INFO,
severityText: 'INFO',
body: 'this is a log record body',
attributes: { 'log.type': 'LogRecord' },
});
It’s a little more verbose than the logging APIs you will be used to. If you would like to keep using your current logging library, you can add an OTEL instrumentation for your logging library.
The main reason you would use logging over Tracing is for global messages. Like Server listening on port .... or Message processor started. These are not related to particular traces and are good info to see in the console logs.
Incorporating instrumentation into your code can be time-consuming, especially with third-party code. That's where instrumentation libraries are helpful. They can be configured for automatic instrumentation, and there are numerous libraries available for popular NodeJS packages like express, undici (the native NodeJS fetch), Remix, and others.
If you're looking for a quick start, you can utilize auto instrumentation, which covers many widely-used NodeJS libraries and is designed to function seamlessly. However, the drawback is that NPM might install instrumentation packages you don't actually need.
import { getNodeAutoInstrumentations } from '@opentelemetry/auto-instrumentations-node';
const sdk = new NodeSDK({
...
// This registers all instrumentation packages
instrumentations: [getNodeAutoInstrumentations()]
});
sdk.start()
Otherwise you can view the Registry to register just the instrumentations you need. It’s a bit more work initially, but it gives you full control over what instrumentations are running and you can configure each one as well.
Now that your application is instrumented, you need to send your telemetry somewhere. This is the job of the exporters. Some telemetry providers/tools like Observability that helps solve problems you couldn't before, Jaeger: open source, distributed tracing platform, Standalone .NET Aspire dashboard - .NET Aspireand others support ingesting open telemetry natively, so you can use one of the Open Telemetry provided exporters like the OTLPTraceExporter.
For application insights, you will need to use npm: @azure/monitor-opentelemetry-exporter, which sends your open telemetry data to application insights.
Now, lets get into Application Insights and how well it works with Open Telemetry. To get started, we need to map between the different terms. This handy table from Data Collection Basics of Azure Monitor Application Insights - Azure Monitor is a good place to start.
|
Application Insights |
OpenTelemetry |
|---|---|
|
Autocollectors |
Instrumentation libraries |
|
Channel |
Exporter |
|
Codeless / Agent-based |
Autoinstrumentation |
|
Traces |
Logs |
|
Requests |
Server Spans |
|
Dependencies |
Other Span Types (Client, Internal, etc.) |
|
Operation ID |
Trace ID |
|
ID or Operation Parent ID |
Span ID |
If we start from the features we want to use in Application Insights, we can dive in, understand how they work, and how we can light them up with open telemetry.
The Application Insights which can work with tracing is Requests and Dependencies. For Exceptions and Custom Events you have to use Open Telemetry logging, and even still if you want to use these two features, you will probably need to use the Application Insights SDK because you need a number of attributes added in a specific way, otherwise it will not work.
|
OpenTelemetry SpanKind |
Application Insights telemetry type |
|---|---|
|
|
|
|
|
The Span’s status determines the Success field of a Dependency or Request. Success is false if the status Error; otherwise true. For INTERNAL Spans the Dependency Type is always "InProc".
A request in Application Insights is essentially a top level trace / root span, for example a HTTP Request, a message handler (from say service bus). These are supported reasonably well, but there are a few gotchas to be aware of.
To create a new Request in app insight, we can register a span.
await tracer.startActiveSpan(
// This name is completely ignored by the exporter
'does not matter',
{
kind: SpanKind.SERVER,
root: true,
attributes: {
// This is what will be displayed in Application Insights as the request name
name: `job.process.${job.type}`,
resultCode: '0' // Come up with your own for non HTTP requests?
}
},
async (span: Span) => {
// Perform 'request'
span.end()
}
)
The main thing to keep in mind here is set the kindto SERVER or CONSUMER otherwise it will not appear as a request and ensure you add a name attribute otherwise it will just be a request without any information next to it (the span name is not used by the Application Insights exporter at all).
You can see the mapping code here.
All other spans are dependencies. By default it will have a type of InProc, but you can also use the other span types.

Read carefully here, there are a bunch of gotcha’s around this!
Application insights will only process exceptions into the exception table if the following is true:
The event name is exception
The active span type is SERVER
This means if you have created a CONSUMER span, or not specified the span type as SERVER and you use the recordException helper in Open Telemetry, the exception will not be visible ANYWHERE in application insights.
Here are 3 different ways to work around this problem.
Always use Kind = SERVER for your service spans. The downside is if it’s forgotten then you may not get exceptions reported and you may not control the span creation, as your instrumentations often create the spans.
Make your own recordException helper, this can start a new server span and add the exception to that
Use the open telemetry logging API to report the exception
We have opted for number 2, as we can ensure the logic works well for Jaeger (local development) and Application Insights. The challenge is when an instrumentation internally uses reportException, you still may not get errors.
You can read the GitHub issue thread on this issue at https://github.com/Azure/azure-sdk-for-js/issues/28247. Hopefully this is something the SDK can fix.
There is no way to report custom events via the Open Telemetry tracing API, to report custom events to Application Insights you must use the Open Telemetry logs API.
export function trackCustomEvent(name: string, attributes: Record<string, string>) {
const data /* TelemetryEventData */ = {
// event name
name,
// required
version: 2,
}
logs.getLogger('default').emit({
severityNumber: SeverityNumber.INFO,
severityText: 'INFO',
body: JSON.stringify(data),
attributes: { ...attributes, '_MS.baseType': 'EventData' },
})
}
Another option is to not use the Open Telemetry SDKs directly, and instead just install npm: applicationinsights.
There is a great talk by Gregor Hohpe called Build Abstractions Not Illusions which sums up the problems with using a client abstraction like the applicationinsights packages.
The applicationinsights package is a wrapper around the Open Telemetry setup, which configures a number of Open Telemetry packages, exporter and default configuration, then provides a shim over the top of the open telemetry APIs (see ApplicationInsights-node.js/src/main.ts at main · microsoft/ApplicationInsights-node.js)
There are some major downsides to this:
If you want to have your own configuration, you need to reach into private properties to inject your own configuration.
The configuration of all the instrumentations are hidden from you, so if you wanted to tweak an individual instrumentation it is challenging.
The shim hides if you are using Tracing or Logging under the covers.
It makes it hard to use local open telemetry tools like Jaeger or the Aspire Dashboard.
The Open Telemetry documentation around how to configure / extend it no longer applies, and applicationinsights may not have extension points for all of the abstracted configuration.
For us, we value the vendor neutral approach as our consultants can learn Open Telemetry and if some of our clients use a different telemetry product we do not have to learn another SDK. It also means our shared code can be instrumented in a standard way.
Using the Application Insights SDK directly also doesn’t solve the issue where exceptions can go missing, because it uses OTEL instrumentations under the covers, and if they combine non server spans with the reportException function, those exceptions will not end up in Application Insights.
Integrating OpenTelemetry with Azure Application Insights provides a powerful, vendor-neutral way to enhance your observability across diverse ecosystems. While there are still some gaps between OpenTelemetry and Application Insights, understanding these differences and applying the right workarounds can help you get the most out of both tools. As the OpenTelemetry SDKs and Microsoft’s plugins continue to evolve, many of these issues will likely be resolved, making the integration smoother over time. Ultimately, whether you choose to stick with Application Insights or adopt a more OpenTelemetry-focused approach, you now have the knowledge to make informed decisions about your telemetry strategy.
I had an absolute blast attending DDD Adelaide recently! It's always great to be part of a community where developers come together to share ideas,...
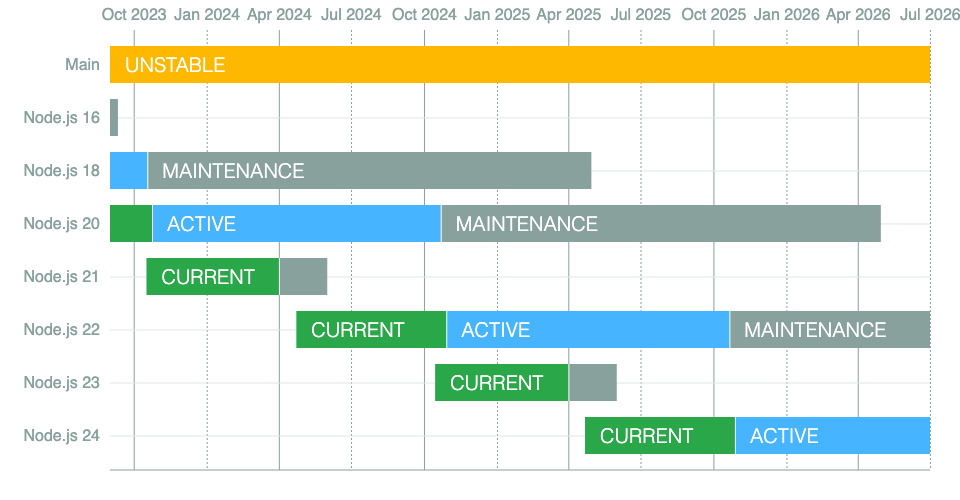
At Arkahna, Node.js is the backbone of many of our applications and projects. It powers everything from our backend services to the build processes...
At Arkahna we build solutions for customers with tight security requirements such as government organisations. Often this means that resources like...